
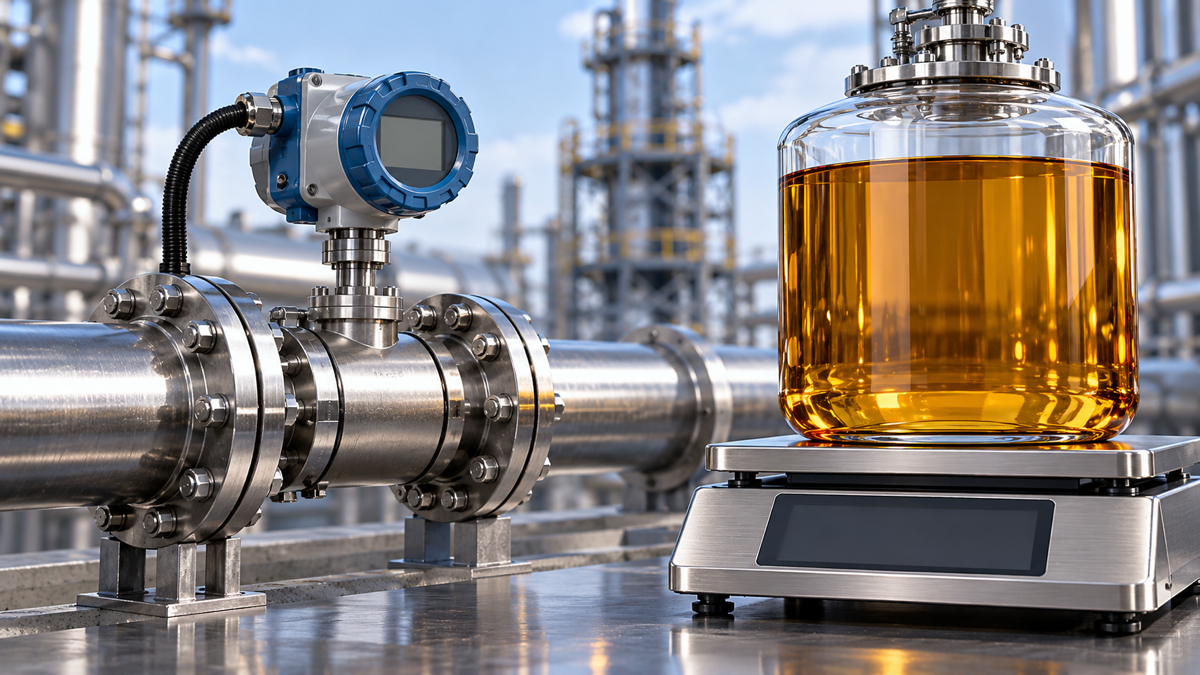
A thermal-oil circuit may show tonnes per hour (t/h) on one display and cubic metres per hour (m³/h) on another. Different numbers do not, by themselves, prove that a meter is wrong. One quantity is mass flow and the other is volume flow. Density, state, time and signal mapping must be established before comparison.
This guide concerns reporting bases and documentation. It does not use display differences to rate pump performance or system efficiency, and it provides no instrument-setting procedure.
Record the full tag, variable name, unit and measurement location at both ends. Mass and volume flow are different quantities. Instantaneous flow, average flow and totalized quantity are also different: tonnes are not tonnes per hour, and cubic metres are not cubic metres per hour.
Check that the label matches the actual signal. A screen may retain an old label after a channel or variable change. Instrumentation personnel should verify mapping and configuration records. Main-line, branch and bypass readings are not automatically measurements of the same object.
Retain timestamps, refresh intervals and statistical windows. Do not subtract a current value from a historical average and call the difference an error. Totalizers additionally require matching start/end times, reset records, direction and interruptions.
When density and volume flow describe the same state and measurement object:
Mass flow = density × volume flow; volume flow = mass flow ÷ density.
| Mass flow | Matching density unit | Volume flow |
|---|---|---|
| kg/h | kg/m³ | m³/h |
| t/h | t/m³ | m³/h |
If mass flow is in t/h but density is in kg/m³, first align the mass units. This article assigns no universal density to thermal oil: grade, formulation and state must match the density source.
A calculation check does not prove that the meter algorithm or sensor is correct. A disagreement first establishes a discrepancy; equipment documentation, configuration and appropriate verification are still needed. Where density varies over time, do not use a single instantaneous density to connect total mass and total volume for an entire period. Verify the actual accumulation method.
Density may be measured by the instrument, entered as a fixed value, received from another system or taken from a product data sheet. Record the source, value, unit, temperature or other state conditions, and revision. Identical field names do not establish identical bases.
A fixed value is not necessarily wrong, but it needs an applicable basis. Ambient-density data do not automatically represent a hot operating point. After a product change, mixing event or material-state change, confirm whether the previous source still applies. For a control-system density variable, trace whether it is received directly or calculated.
Emerson’s introductory article describes mass-flow, density and temperature information for the Coriolis technology discussed.[1] This does not establish identical capability for every model, option or installation. Confirm actual functions from the specific equipment documents. Do not change density merely to make displays agree.
Two readings both labelled m³/h may represent actual operating volume and volume converted to an agreed reference state. Their density bases may differ. The common unit does not remove the need to check the state.
For “standard volume,” “corrected volume” or “temperature compensation,” obtain the project definition: reference temperature, relevant pressure conditions, fluid model and whether the function is enabled for the variable being read. Names do not establish one universal reference basis or algorithm.
If information is missing, record “mass-flow identity confirmed; volume reference state pending” rather than declaring a conversion fault. Any conversion path should come from applicable documentation, not an untraceable correction factor.
Emerson explains that the sensor detects fluid properties and operating parameters, while the transmitter processes sensor signals and communicates measurement information to the control system.[1] This provides an organizing framework, not proof of a particular device’s output calculation.
Measurement: model, tag, fluid, location and measured variable.
Transmitter: selected output variable, unit, range, channel and configuration revision.
Control system: input point, engineering units, scaling, label and time handling.
Refresh, averaging or filtering settings may affect a comparison, but only actual configuration evidence can show whether they explain the observed difference. Authorized personnel should handle configuration changes and equipment checks under the relevant device documents and site procedures.
| Item | Information to retain |
|---|---|
| Object | Purpose, location relationship, tags, model and fluid identity |
| Variable | Mass/volume; instantaneous/average/total; complete units |
| Time | Timestamps, statistical windows, refresh and reset records |
| Density | Value, unit, source, state and document revision |
| Volume basis | Actual or agreed reference state and calculation basis |
| Signal chain | Output variable, input point, scaling, label and revision |
| Closure | Specific discrepancy, missing documents, owner and written response |
Keep original screenshots or exported records separate from recalculations. Distinguish verified facts, possible explanations and judgments still requiring equipment evidence. If a discrepancy remains after the records are complete, refer it to the instrument supplier or appropriate technical personnel. Do not keep changing density until the numbers happen to match.
t/h and m³/h are not directly comparable numbers. Identify the quantity, then align density at the relevant state, volume basis, time window and signal chain. Recalculation is one step; traceable conditions and evidence support the final judgment.
[1] Emerson, Maggie Schmidt, The Basics of Flow Measurement with Coriolis Meters: Part 1, September 9, 2014. The reference supports the measurement variables and component roles only; general marketing performance claims are not adopted. The mass–volume relationship is a basic physical relation. No model-specific algorithm manual has been reviewed, and no universal density, correction factor or device algorithm is prescribed.